Compare this route with the last one
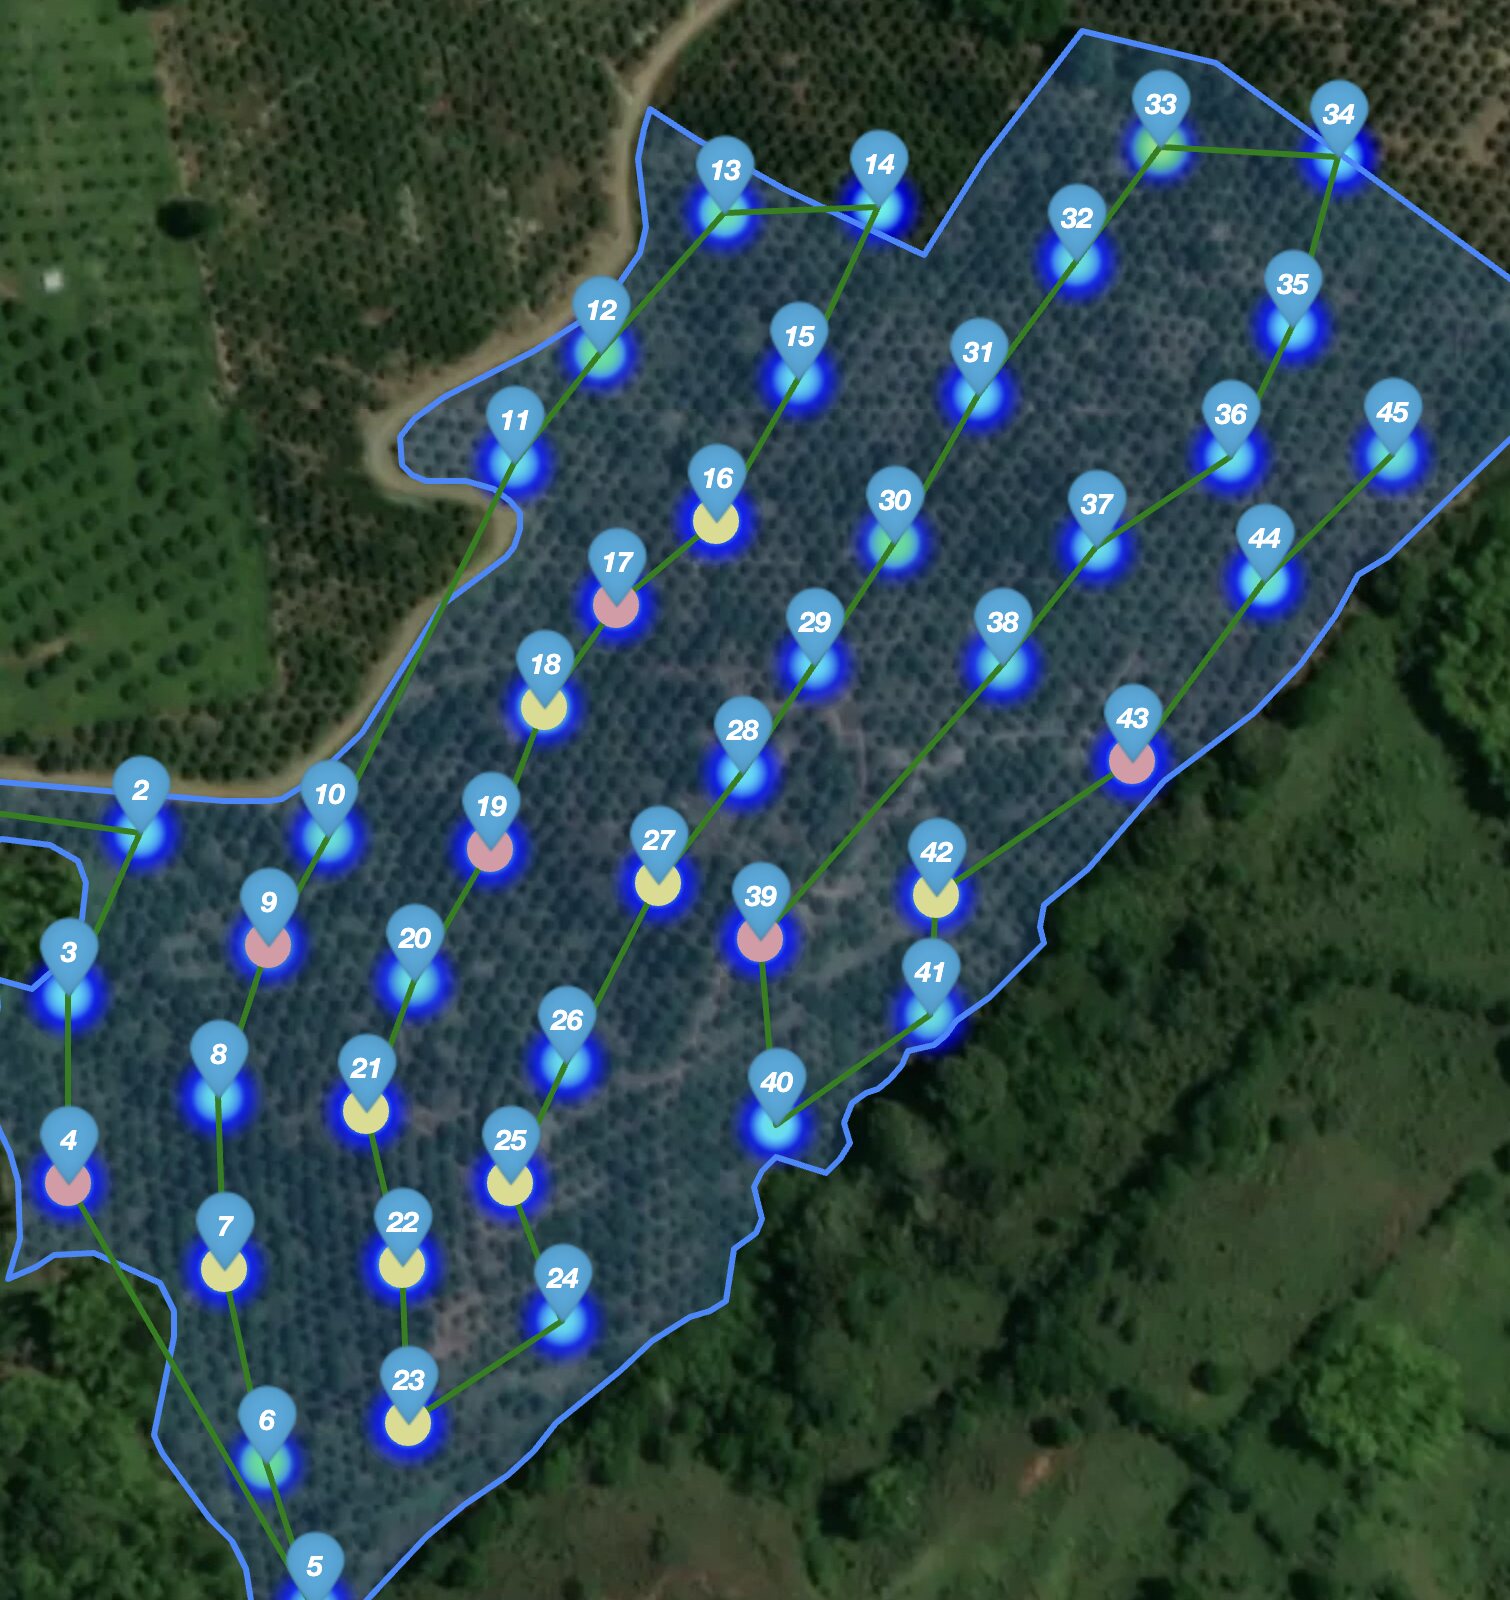
Put two routes of the same lot side by side: trees, samples, and every indicator with its change. On the map, the difference shows in red where it got worse and in green where it got better.
- Positive percentage, average, and maximum for each field
- Heatmap of the earlier route, the current one, or the difference
- The hot spot located tree by tree on the map
arloagro.com / sanitation-routes / compare
Route comparison
Compare with
SR-4812 · September 23, 2026
Earlier route
SR-481229 trees inspected
Current route
SR-493129 trees inspected
Sampling
| Metric | Earlier route | Current route | Change |
|---|---|---|---|
| Trees inspected | 29 | 29 | 0 |
| Percentage sampled | 1.51% | 1.51% | 0% |
| Samples | 116 | 116 | 0 |
Trees
# of mites per lens
| Metric | Earlier route | Current route | Change |
|---|---|---|---|
| Average | 0.28 | 0.21 | -0.07 |
| Max | 4 | 3 | -1 |
Samples
Rust mite
| Metric | Earlier route | Current route | Change |
|---|---|---|---|
| Positive percentage | 3.1% | 8.17% | +5.07% |
+
−
Earlier
Current
Both
Diff
Worse
Better